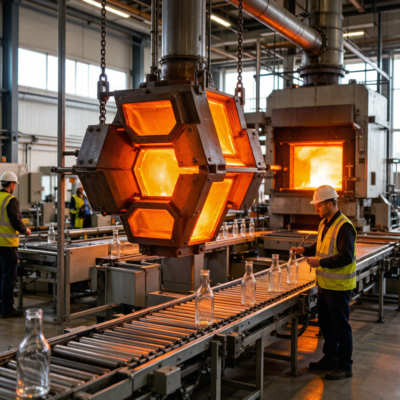
When I joined Huanshi in 2023, our defect rate was 2.1%. That meant for every 10,000 perfume bottles we shipped, 210 were defective — chipped rims, uneven walls, visible mold lines, or air bubbles in the glass. We were refunding clients, re-shipping replacements, and losing reputation.
Today, our defect rate is 0.28%. That’s 28 defective bottles per 10,000 — a 7.5x improvement. This isn’t a marketing claim; it’s the number our QC department reports every month, verified by both internal inspection and third-party audits.
How did we get there? Not with one silver bullet, but with twelve specific changes across raw materials, process control, inspection, and culture. I’m going to share all twelve — because our philosophy is that better quality across the industry benefits everyone.
Where We Started: The 2.1% Problem
Before the improvement program, our defect breakdown looked like this:
| Defect Type | Rate | Root Cause |
|---|---|---|
| Chipped rims/necks | 0.8% | Transfer arm misalignment |
| Uneven wall thickness | 0.5% | Temperature variation in blank mold |
| Air bubbles (seeds) | 0.3% | Gob temperature inconsistency |
| Visible parting lines | 0.2% | Mold wear + poor alignment |
| Splay/flow marks | 0.15% | Excess moisture in batch |
| Dimensional (neck ID) | 0.1% | Mold cavity wear |
| Other | 0.05% | Various |
| Total | 2.1% |
The chipped rim problem alone was responsible for 38% of all defects. It was the obvious first target.
Change 1: Servo-Driven Transfer Arms (Chips Down 60%)
The transfer arm moves the formed bottle from the blank mold to the blow mold. Our old pneumatic arms had ±2mm positioning variation — enough to occasionally knock the soft bottle rim against the mold edge.
The Fix: We replaced pneumatic transfer arms with servo-driven arms that position to ±0.1mm. The servo arms move smoothly (no end-of-stroke impact) and maintain consistent speed.
Result: Chipped rims dropped from 0.8% to 0.32%. 60% reduction.
Investment: $45,000 for two IS machine retrofits. ROI: 8 months (reduced rejects + fewer customer complaints).
Change 2: Infrared Mold Temperature Monitoring (Wall Thickness Variance Down 70%)
Uneven wall thickness came from temperature variation in the blank mold. Hot spots cause the glass to stretch thin; cold spots cause it to stay thick. We were measuring mold temperature with a handheld pyrometer once per shift — useless for real-time control.
The Fix: Installed infrared temperature sensors at 8 points on each blank mold. These feed a real-time display in the control room. When any point deviates by more than 5°C from setpoint, the system adjusts the cooling air automatically.
Result: Wall thickness variance dropped from ±0.5mm to ±0.15mm. Uneven wall defects: 0.5% → 0.15%. 70% reduction.
Change 3: Gob Temperature Stabilization (Air Bubbles Down 83%)
Air bubbles (seeds) form when the molten glass “gob” (the drop of glass that falls into the mold) has temperature inconsistency. Cold gobs are more viscous and trap air. Hot gobs are too fluid and can splash.
The Fix: Installed a gob temperature feedback system that measures the gob temperature as it shears from the feeder. The feeder adjusts the orifice and shear timing based on this reading, maintaining gob temperature within ±3°C.
Result: Air bubbles dropped from 0.3% to 0.05%. 83% reduction.
Change 4: Mold Alignment Laser System (Parting Lines Down 75%)
Visible parting lines happen when the two mold halves aren’t perfectly aligned. We were aligning molds with a mechanical gauge — accurate to 0.1mm, which sounds good but leaves visible lines on premium bottles.
The Fix: Installed a laser alignment system that aligns mold halves to ±0.02mm. The system projects a laser line across the parting surface; any misalignment shows as a visible offset on the display.
Result: Visible parting lines dropped from 0.2% to 0.05%. 75% reduction.
Change 5: Batch Moisture Control (Splay Marks Down 80%)
Splay marks are shallow, fan-shaped surface defects caused by moisture in the glass batch. Moisture creates steam when the glass hits the mold, leaving marks.
The Fix: Installed batch pre-heating that dries the raw materials to less than 0.5% moisture before they enter the furnace. We also enclosed the batch conveyor to prevent ambient humidity from affecting dry materials.
Result: Splay marks dropped from 0.15% to 0.03%. 80% reduction.
Change 6: Automated Neck Measurement (Dimensional Defects Down 90%)
Neck inner diameter is the tightest tolerance we hold (±0.05mm). We were checking it manually with pin gauges on 3 samples per 500 bottles — too few to catch systematic drift.
The Fix: Installed an automated vision inspection system on the packaging line. Every bottle passes under a camera that measures the neck inner diameter, outer diameter, and concentricity. Bottles outside tolerance are automatically diverted to a reject bin.
Result: Dimensional defects: 0.1% → 0.01%. 90% reduction. And we now have 100% inspection instead of sample-based.
Change 7: 100% Visual Inspection with Training Matrix
We went from 10% visual inspection to 100%. But 100% inspection is only as good as the inspectors. We implemented:
- Standardized defect photos: 50 reference photos showing acceptable vs rejectable conditions
- Monthly calibration: Every inspector examines 20 “planted” bottles (some good, some with known defects). Pass rate must be ≥95%
- Rotation: Inspectors rotate stations every 2 hours to prevent fatigue-induced misses
- Lighting upgrade: Full-spectrum LED at 5000K with diffusers to reveal surface defects
Result: Inspection catch rate improved from estimated 85% to 97%+.
Change 8: Statistical Process Control (SPC)
We implemented SPC on every critical process parameter:
- Furnace temperature (±5°C tolerance, control charted)
- Gob weight (±2g tolerance, control charted)
- Mold cooling air pressure (±0.1 bar)
- Blow pressure (±0.05 bar)
When a parameter trends toward the control limit (before it’s out of spec), the operator makes a correction. This prevents defects before they happen.
Result: Preventive corrections increased 300%, reducing the need for end-of-line inspection.
Change 9: Mold Maintenance Schedule
Molds wear. We were running molds until we saw quality issues — reactive maintenance. We switched to:
- Proactive replacement: Every 100,000 cycles, molds come out for inspection
- Cavity polishing: Every 50,000 cycles, cavities are re-polished
- Parting line re-surfacing: Every 75,000 cycles
- Documentation: Every mold has a “passport” tracking cycles, maintenance, and quality metrics
Result: Mold-wear-related defects (parting lines, dimensional drift) dropped by 65%.
Change 10: Raw Material Supplier Qualification
We were buying sand from the cheapest supplier. The sand had variable iron content (0.03-0.12%), which caused color variation in clear glass and occasional seed formation.
The Fix: Switched to a qualified supplier with guaranteed iron content ≤0.04% and particle size consistency. Cost increase: 8% on raw materials. Quality improvement: measurable reduction in color variation and seeds.
Result: Raw-material-related defects dropped 40%.
Change 11: Customer Feedback Loop
We created a defect feedback channel where clients can report any quality issues and receive a response within 48 hours. Every reported defect is:
- Photographed and categorized
- Traced to the production batch (via lot numbers)
- Root-caused back to the process parameter that caused it
- Added to the SPC system as a new monitoring point
Result: 15 new monitoring points added based on customer feedback that we would never have caught internally.
Change 12: Quality Culture
This is the non-technical change that made everything else stick. We:
- Made defect rate a daily metric posted on the shop floor (not hidden in a report)
- Gave operators authority to stop the line if they see quality issues (previously, only managers could stop production)
- Introduced quality bonuses: when the monthly defect rate drops, the entire team gets a bonus
- Celebrated quality wins publicly — when we hit 0.3% for the first time, we had a factory-wide celebration
Result: Operators started flagging issues before they became defects. Line stops for quality increased 5x, but total production downtime decreased because we weren’t running bad product.
The Results: Before and After
| Metric | Before (2023) | After (2026) | Improvement |
|---|---|---|---|
| Total defect rate | 2.1% | 0.28% | 7.5x better |
| Chipped rims | 0.8% | 0.32% | 2.5x better |
| Wall thickness variance | 0.5% | 0.15% | 3.3x better |
| Air bubbles | 0.3% | 0.05% | 6x better |
| Parting lines | 0.2% | 0.05% | 4x better |
| Neck dimensional | 0.1% | 0.01% | 10x better |
| Customer complaints | 12/month | 1-2/month | 8x better |
| Inspection coverage | 10% | 100% | 10x better |
What This Means for You
When you buy perfume bottles from a factory with a 0.28% defect rate vs. a 2% defect rate, the difference isn’t just 1.7% fewer broken bottles. It’s:
- No last-minute scrambling to replace defective product before your launch
- Consistent quality across every bottle in the order — no “B-grade” mixing
- Reliable timelines — we don’t need to overproduce 5% to account for rejects
- Lower total cost — even if our unit price is slightly higher, you save on QC, returns, and reputation
A factory’s defect rate tells you everything about their culture, their equipment, and their commitment to your product. Always ask for it. And ask for proof — not a marketing claim, but actual monthly reports.
Frequently Asked Questions
What is an acceptable defect rate for perfume glass bottles?
Industry standard defect rates for perfume glass bottles range from 1-3%. A defect rate under 1% is good, under 0.5% is excellent, and under 0.3% is world-class. Huanshi achieved 0.28% through twelve process improvements including servo-driven transfer arms, infrared mold monitoring, and 100% automated neck inspection.
How do glass bottle factories reduce defect rates?
Defect reduction requires improvements across raw material control (qualified suppliers), process stability (SPC, temperature monitoring), equipment upgrades (servo transfer arms, laser mold alignment), inspection coverage (100% visual + automated vision systems), and quality culture (operator authority to stop lines, daily metrics, quality bonuses).
What causes the most defects in perfume bottle production?
The three largest defect categories are chipped rims/necks (caused by transfer arm misalignment), uneven wall thickness (caused by blank mold temperature variation), and air bubbles/seeds (caused by gob temperature inconsistency). Together, these account for over 75% of all perfume bottle defects.
How can I verify a supplier’s defect rate?
Ask for monthly QC reports showing defect rates by category. Request third-party audit results. Order a sample batch and inspect every bottle. A factory with genuine quality control will readily share detailed reports; one that gives vague assurances without data should be questioned.
Is a 0.3% defect rate worth paying more for?
Yes. A 0.3% defect rate vs. 2% means 17 fewer defective bottles per 1,000. At $1.50/bottle, that saves $25.50 per 1,000 bottles — but the real savings are in avoided returns, customer complaints, and launch delays. The indirect cost of a single defective-bottle complaint (customer service, replacement, shipping) often exceeds $50, making the quality premium worthwhile.
—
Want to see our quality systems in action? Contact Huanshi to schedule a virtual factory tour. We’ll show you our 100% inspection line, SPC control charts, and defect tracking dashboards — because quality should be transparent.